by the staff of DroneDeploy, republished with permission
Misconceptions and advice from ag drone industry experts
In part two of this series on NDVI drones you’ll hear from Markus Weber and Ray Asebedo who round out a collection of advice with more technically-focused discussion on vegetation indices and how they’re used with drones.
Missed part one? Read it here.
Markus Weber
 Tech savvy agricultural businessman. Four words that are a good start but barely scratch the surface of what make up Markus Weber.
Heading up AgEagle Canada, Markus feasts or famines on how well he can help you understand the utility of NDVI and how best to make use of it. Markus’ clients purchase AgEagle drones that come equipped with modified NIR (near infrared) cameras which are capable of producing NDVI imagery.
Markus has somewhat clairvoyant insights into the agricultural remote sensing industry and how trends will develop in the coming years.
Green is not always good, red is not always bad.
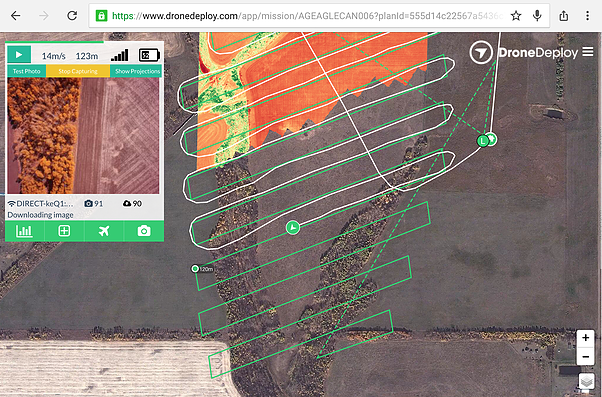
Why is NDVI so popular and what does it mean to you?
NDVI itself has been around a lot longer than other vegetation indices. It’s the most prevalent so that’s why it’s talked about more than others. NDVI shows you the amount of photosynthesis in plants. But unless you’ve controlled for all possibilities, you can’t know if what it’s telling you is good or bad. NDVI is one piece of the puzzle — you’ve still got to get boots on the ground. It takes knowledge.
In order to effectively use a NDVI image for management decisions, or to diagnose what the issue is (as opposed to just where it is), one needs to understand the crop varietal, the history of the field, growth stage, fertilization, pesticides, and the plant growth environment (primarily moisture and temperature).
So what do the colors on NDVI maps mean?
NDVI is based on a false color scale that often uses green for high NDVI values and red for low values. Generally, green can mean a plant is healthy and red can mean a plant is unhealthy but you have to be very careful here. Green is not always good and red is not always bad. There are many factors at play.
For example, a very high NDVI value (green) could mean high weed pressure, as actively growing weeds have similar reflectance to actively growing crops.
I saw that this fall in newly-emerged winter wheat that had heavy volunteer peas due to poor germination of the peas in the dry spring.
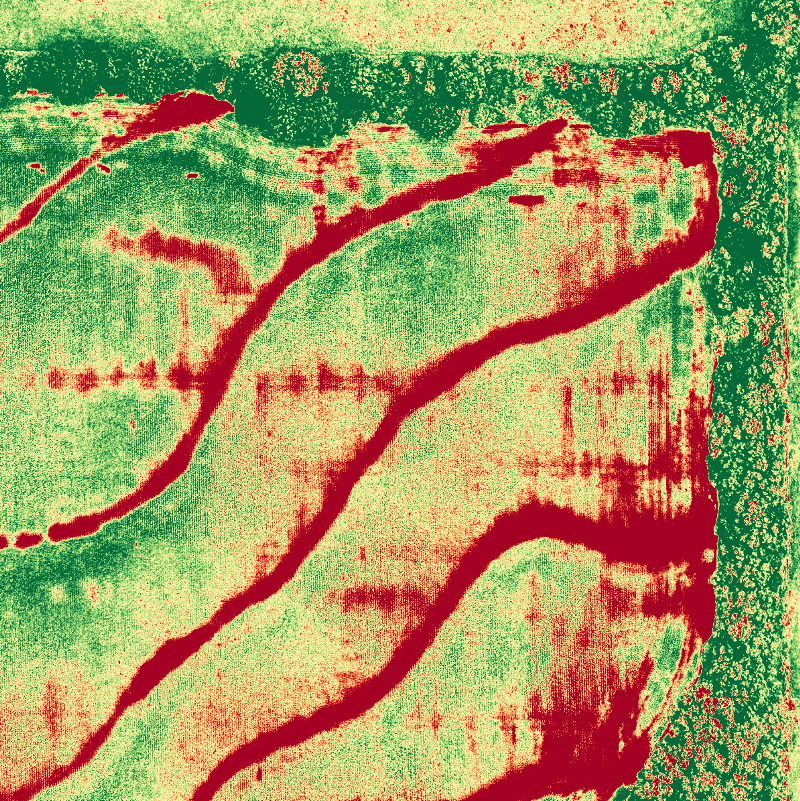
Rain eventually came much later in the season and created late flushes of peas, including after the winter wheat crop was seeded in the fall.
In this particular scenario, the higher NDVI values (green) actually show those areas where there are heavier volunteer peas, while the areas showing lower NDVI actually have bare soil or dead pea residue between rows of otherwise reasonably good winter wheat crop.
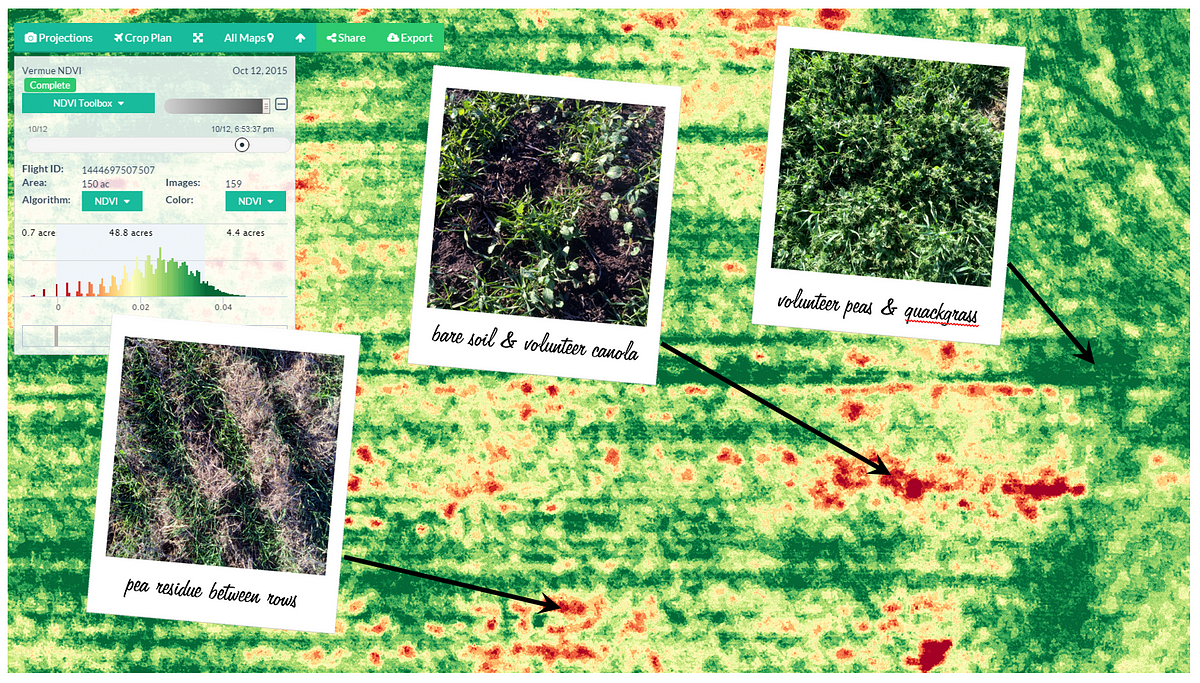
Without ground-truthing, one might assume that these red areas are showing poor crop growth, but in reality, the dead pea plant residue is not actually a problem — in fact, it even helps prevent erosion and hold moisture.
As long as the peas don’t outcompete the wheat like they have in this particular image, they may actually contribute to the wheat’s available nutrients in the spring by fixing nitrogen in the fall. UAV imagery doesn’t make crop scouting obsolete — it can just help make it both more effective and more efficient. It will be most interesting to fly the same field again this April to see how wheat growth varies across the field after winter.
Do you have any stories about what AgEagle has allowed you to do?
AgEagle drones can be applied extremely well in grain-corn areas. Many growers typically apply only some of the crop’s large nitrogen requirement by seeding time. If the other variability factors like topography and soil are understood (from yield history or satellite-based zoning, for example), then a current NDVI shot can be used to calculate nitrogen topdressing rates. This can be done since it’s assumed that nitrogen is a key limiting growth factor when it has been deliberately under applied in the spring.
A grower or agronomist without all of that field-specific agronomic information cannot assume that a drone-based NDVI image alone will produce a prescription map. On the other hand, it can be an absolutely essential part of effective and timely nitrogen prescriptions in top-dressing management scenarios.
We have less of those examples in western Canada dryland crops, as many people zero-till and add all of their nitrogen before or with the seed. In those cases, high-resolution aerial NDVI imagery becomes more of a forensic tool than a data-generation tool. It really does help to highlight variability where it would otherwise be invisible to the naked eye, or from the ground.
What would you tell people creating new agriculture drone businesses?
I would tell them they need to ground-truth their drone imagery, which should be part of the service. If you can’t ground-truth, then provide the imagery to someone who knows how to — an agronomist, unless the farm has the time to do that themselves.
Aerial NDVI imagery is a great tool for an agronomist’s toolbox, because it highlights variability not visible from the ground or with the naked eye. But NDVI just shows where a problem is. You still need to get out in the field, touch some plants, and get into the soil.
~ ~ ~
Ray Asebedo
 Ray writes vegetation index algorithms for a living. He holds a PhD in soil fertility from Kansas State University where he is currently a Professor of Precision Agriculture in the Department of Agronomy.
Growing up in a rural Kansas community, everything was ag. In high school, classes on plants, soil, and weeds were required. John Deere would even drop in for visits, attempting to hire students as soon as they graduated.
Needless to say, Ray’s knowledge of the history and applications of vegetation indices runs deep.
If the crop is a plant factory, the NDVI image can give you a gauge of how big that factory is.
How did you get into creating vegetation indices and algorithms and what is the future of your research?
I started in 2008 when I joined the soil fertility program at Kansas State. I got really interested in the idea that we can use drones to gauge what’s happening with plants. At the time, I was less fascinated with the vegetation indices themselves — I really wanted to determine how we can take this information and transform it into an actual recommendation for the grower. Without additional information to support the vegetation index (VI) data—such as soil and weather data—it won’t provide any clear indication of what is stressing the plant.
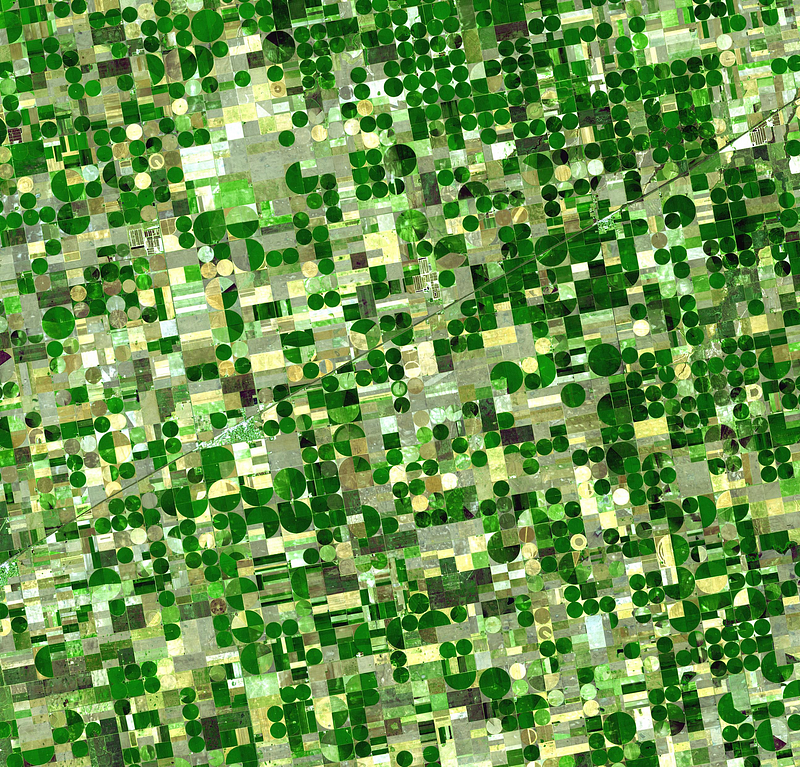
My initial start of using remote sensing in agronomy began with satellite imagery and active optical sensors, i.e. Holland Scientific Crop Circle and Trimble Greenseeker. At the time, acquiring imagery from manned airplanes was not cost effective, therefore I only focused on optical sensor technologies farmers could readily acquire.
However, handing over a VI map like NDVI to a farmer really didn’t mean anything to them. Most often the areas shown to be “bad” on the NDVI map could already be easily identified by the farmer.
The farmer brings us (agronomists) to the field to help identify the problem and recommend a solution that makes them the most profit per acre. However, there aren’t enough agronomists to be in every crop field. So I thought to myself, there is no reason why I can’t program agronomic algorithms to generate artificial intelligence for drones.
Let’s give the drone a Ph.D. in agronomy and put one in every field to assist farmers with making agronomically sound decisions.
What are you trying to accomplish with your research?
A lot of people get wrapped up in technology, especially the hardware. I’ve used it as a means to an end. Optical sensors such as cameras are little more than the eyes of the machine. Just like a human, a machine can see differences in a crop field, but without proper training, it will not be able to identify the problem. My focus has been on “teaching” the machine to think like a human agronomist.
When a human agronomist like myself goes out into the field and makes assessments, I’m running algorithms in my head that bring multiple data layers into account, such as soil characteristic changes on the horizontal and vertical axis, and how that will interact with the plant under different weather conditions.
No agronomist will go to the crop field and make recommendations based on just the visual data. So we should not expect a drone to do better than a human on just one visual data layer such as NDVI.
However, a question that burns in my mind is; I can teach a human to understand the soil, crops, remote sensing, etc. — so why can’t I teach a computer to do the same thing?
Humans have been teaching humans for centuries, but humans teaching machines is still very new and requires a unique set of skills and interdisciplinary research teams. Programming the agronomic algorithms to generate artificial intelligence for improving agronomic decisions in precision agriculture is the goal of my research.
I would love to see one day that there is an “Agro Robot” on every farm assisting farmers in their quest to make the right agronomic decision. One day this will no longer be precision agriculture, it will just be normal agriculture.
Tell us more about vegetation indices. In particular, NDVI.
Every vegetation index is built for a specific purpose of identifying certain plant characteristics — or at least it should be. Some are broader strokes and less specific than others. Far and away, the most popular is NDVI, and that’s the only one everyone talks about.
NDVI = (NIR-RED) / (NIR+RED)
NDVI was first used in 1973 by Rouse et al. for monitoring vegetation systems in the Great Plains. Most people don’t realize that NDVI is that old. NDVI should be considered a broad stroke VI.
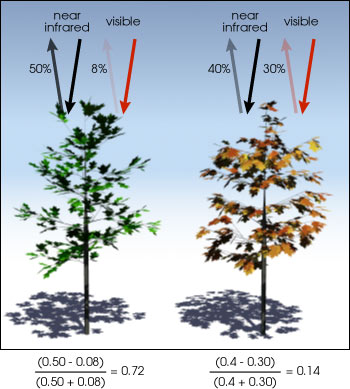
NDVI uses two wavelengths, most commonly Red and near infrared (NIR). The NIR interacts with the plant cells and reflects back to the camera’s sensor. The more plant material there is on the ground, the more NIR light you get reflecting back. The Red is absorbed by chlorophyll for photosynthesis; the more healthy chlorophyll present the less Red light will reflect to your camera’s sensor. If the crop is a plant factory, then the NDVI image gives you a gauge of how big the plant factory is and how efficiently it is running.
Do you agree that there are misconceptions about NDVI?
There are, especially on what it can actually do. NDVI works well for a broad stroke approach for monitoring crop health but it is not capable of identifying specific types of crop stress. It can only help determine that a type of stress is present. For identifying specific crop stress such as water stress, different wavelengths with a different VI would provide greater sensitivity and direct information on the water status of the crop.
NDVI is still a good VI tool in the toolbox, and could be considered to be the crescent wrench. However, we have a big VI toolbox nowadays with lots of different VIs for specific jobs. You may have a better tool in there than the NDVI crescent wrench. Otherwise, if you stick with NDVI, you will require additional ancillary data to use deduction methods to actually identify the potential problem that is shown in the NDVI image.
A NDVI result alone is too broad to give you an exact interpretation to what the value means — you need to apply additional ancillary data to make that interpretation. That’s the unfortunate thing about NDVI; it’s so broad.
What advice do you give to people who want to start using NDVI imagery with drones?
If they’re just getting started, get the $1,000 drone and use the standard RGB sensor. A basic system for getting your feet wet is absolutely critical. There are a lot of things we can do solely with RGB imagery. Humans see in RGB and it is our primary sense for identifying things in the world around us. Therefore, it’s not that difficult for a person to see an image in RGB and start identifying problems in his crop field.
Since NDVI uses the NIR wavelength, we start seeing things in the field that we couldn’t see before, so it can take some time for our minds to adjust to this different method of vision.
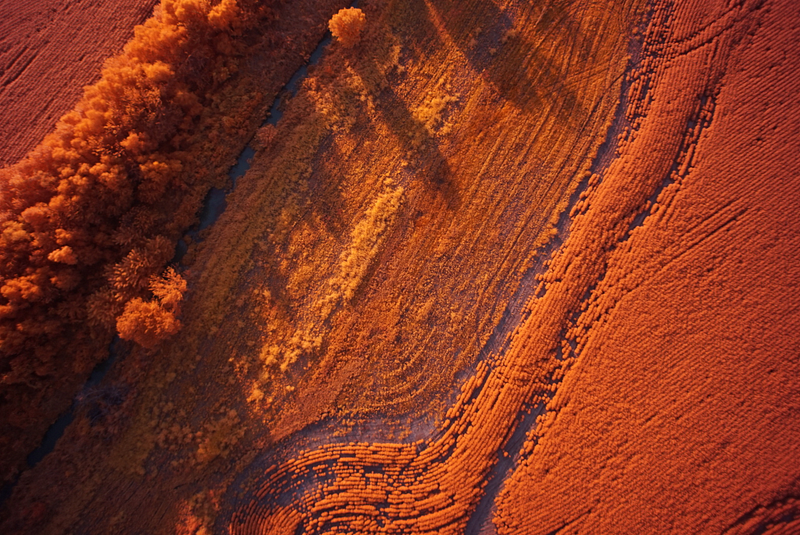
NDVI and NIR imagery show a deeper level of sensitivity. I’ll show farmers NIR imagery, but I always show them the RGB image so they can make a connection to what they are seeing and fully understand its value on the farm.
To learn more about what DroneDeploy offers for ag drones, please see their Agricultural Toolbox features post.
Ready to get started processing your own drone imagery? Sign up for a free DroneDeploy account today.
Frank Schroth is editor in chief of DroneLife, the authoritative source for news and analysis on the drone industry: it’s people, products, trends, and events.
Email Frank
TWITTER:@fschroth

Leave a Reply